
FishMonitor
Service Highlights
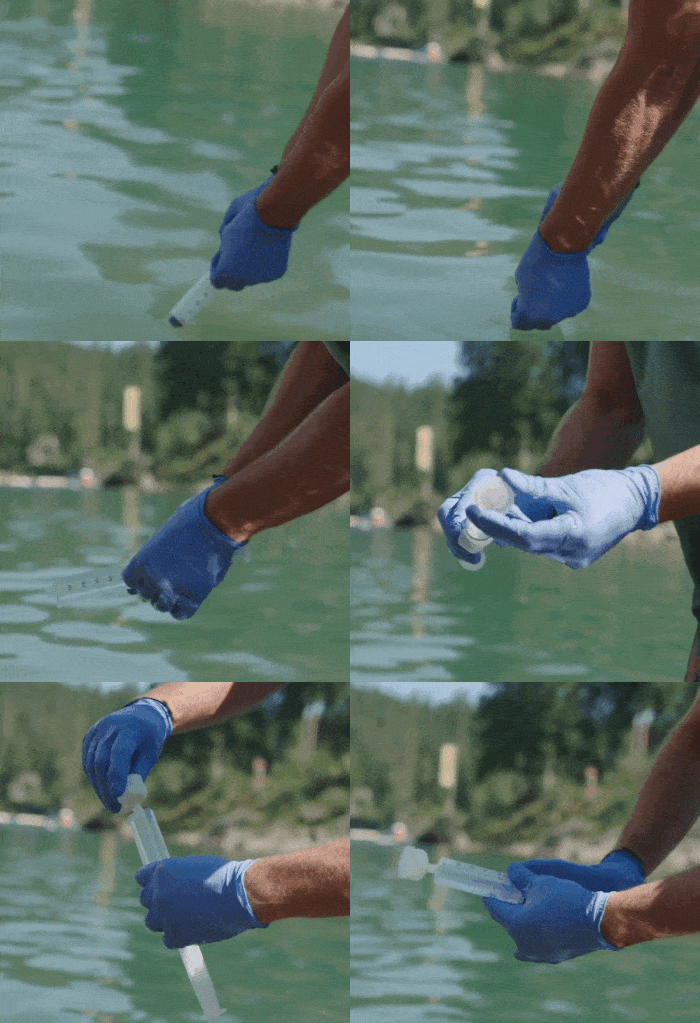
Easy on-site water sampling method (non-expert friendly) with a simple syringe and filter
Accurate analysis in our Swiss lab
Suitable for every lake, river, water body
Confirm the presence of fish species
Optional: add more taxonomic groups to the analysis to get a comprehensive picture
Gain semi-quantitative information
Service Includes
Sample collection kit for water for self-sampling
Plan and instructions for sampling
DNA extraction and sequencing of the 12S gene in our lab
Bioinformatic analysis for taxonomic assignment and quantifiable DNA signal
Why measure fish biodiversity?
Measuring fish biodiversity has diverse applications:
Conservation and Management: Monitor fish populations, identify threatened species, and implement conservation strategies.
Ecological Research: Study distribution patterns, species composition, and interactions in different habitats.
Environmental Impact Assessments: Assess project impacts on fish biodiversity and ensure compliance.
Aquaculture and Fisheries Management: Monitor species composition, optimize practices, and implement conservation measures.
Restoration and Rehabilitation: Evaluate success of habitat restoration efforts and make informed decisions.
SimplexDNA provides flexible solutions for all of these these applications.


What can SimplexDNA offer?
Our method can pick up even small traces of genetic material left by organisms in the water, which is called environmental DNA or eDNA. Using our eDNA analysis we can identify organisms that are present at a given place and time without direct observation. Detection and monitoring with this method is accurate, scalable and low-cost compared to alternatives. Sampling can be carried out by non-experts following a set of simple instructions.
Starting from a filtered water sample, we carry out eDNA metabarcoding and bioinformatic analysis to generate taxonomic assignments, semi-quantitative data and reports. We offer a flexible service from quoting over sampling to final data delivery.
Contact us for a quote. We will be happy to advise on sampling in your individual setting.
Understand fish communities
The figure on the right is a scatter plot with green dots representing the presence of different fish species at different sampling sites. The x-axis shows the sampling sites and the y-axis shows the fish species. The size of the dots represents the relative abundance of each species at each site. This figure helps to understand the fish community composition and distribution in the river.


Questions & Answers
What is necessary to make a quotation?
Answer: Map of the area, info on which taxonomic groups you wish to find, timeline for results
Can you carry out the sampling in the field?
Answer: Yes within Switzerland and bordering regions. However, the sampling instructions are very simple and the process can be carried out by non-expert personnel.
Is the data quantitative? Can you count individuals?
Answer: The data is semi-quantitative, which means that different factors like proximity, population size and molecular effects have an influence. The number of organisms can not be inferred, but comparisons can be made within focussed taxonomic groups.
Successfully delivered showcase projects
Canton Aargau/Canton Bern/Canton Solothurn
"Monitoring of non-native species using eDNA as part of the coordinated biological survey of the Aare river"
Canton Zug
"eDNA survey of fish diversity for the Zug Fish Atlas"
Canton Aargau
"Impact monitoring of watercourse revitalization: eDNA survey of fishes"
Canton Aargau
"Monitoring of non-native species using eDNA in Lake Hallwil"


